Inside the sample report
A monthly MIS report you can use to make decisions.
A useful financial report connects the headline numbers to the entries behind them. Here is how to read the 21-page sample shown on our homepage.
Start with the month at a glance
The September 2026 sample summarizes income, gross profit, expenses, net income, cash and runway. It shows losses through April, followed by five profitable months from May to September and a positive year-to-date result. The figures below are transcribed from page 3 of the public sample to illustrate the report format.
| Measure | Sample value |
|---|---|
| Total income | $590,000 |
| Gross profit | $475,000 |
| Gross margin | 80.5% |
| Total expenses | $309,000 |
| Net profit | $199,000 |
| Year-to-date net profit | $244,000 |
| Cash at month end | $5.91 million |
| Change in cash versus August | +$178,000 |
| Estimated runway | N/A — operating cash inflow |
Figures are rounded. The sample labels expenses separately from cost of services; subtracting the displayed expense total from gross profit does not reproduce net income without the other statement lines.
Open the original at-a-glance report page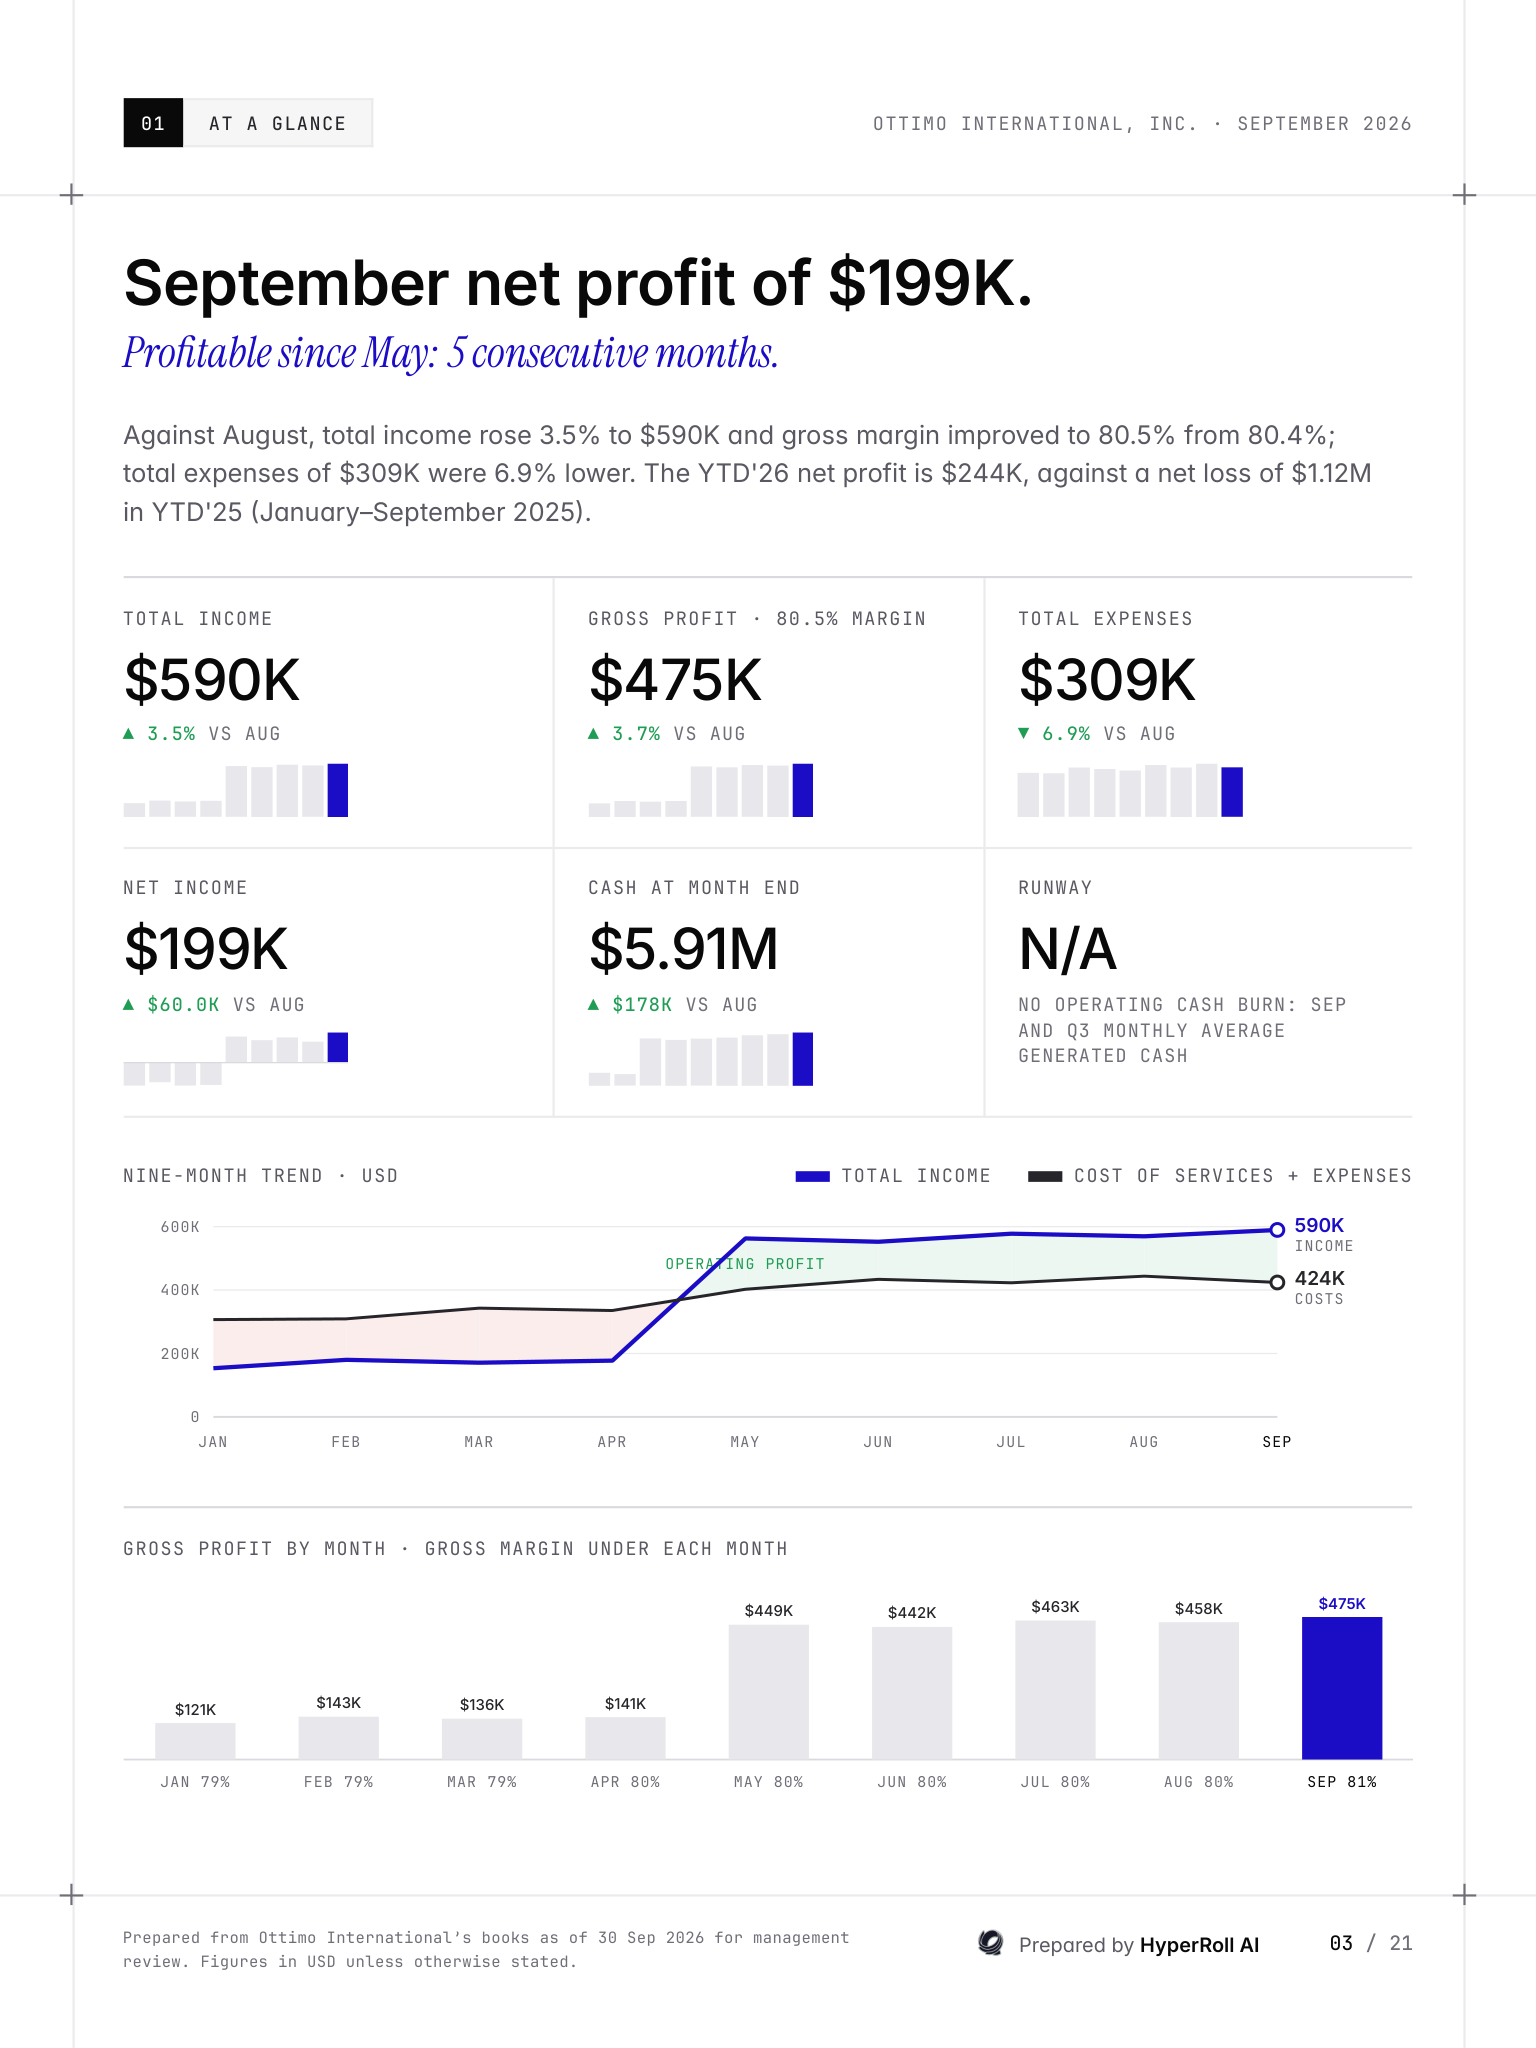
Read profit and cash together
The sample shows a September net profit of $199,000 and a cash increase of $178,000. Those are different measures: accrual accounting and the timing of collections and payments mean cash movement can differ from profit. The cash-flow pages show the bridge, monthly cash generation and the changes that drove it.
Runway is shown as N/A because both September and the third-quarter monthly average generated operating cash. The third-quarter average operating cash inflow is $191,000 per month. When operations use cash, the report estimates runway by dividing closing cash by the latest month’s outflow and the latest quarter’s average monthly outflow.
Follow the numbers into the detail
- Summary and changes, pages 3–5: the month at a glance, year-to-date profit and loss alongside the balance sheet, and a bridge explaining the change in results.
- Performance and cash, pages 6–7: quarterly comparisons, year-to-date cash movement, burn and runway.
- Revenue and costs, pages 8–11: customer concentration, revenue trends, spending by nature, deferred revenue, and receivable/payable ageing.
- Checks, page 12: cross-statement tie-outs and the basis used to prepare the report.
- Detailed statements, pages 14–21: the balance sheet, monthly and year-to-date profit and loss, monthly cash flows and sales by customer.
Start with the business question, then follow the summary to its supporting schedule. A margin change belongs with revenue and delivery costs; a cash dip belongs with collections, payments and the cash-flow statement.
Detailed reporting starts with detailed bookkeeping
HyperRoll AI splits payroll, sales and expenses by team, person, customer and vendor as they are booked. An accountant checks each entry. That detail gives the reports a useful foundation: team costs, customer concentration and vendor trends can be traced back to the books.
Reports and the chart of accounts are adapted to the business. The sample shows a possible format, not a fixed list of deliverables for every engagement. Explore our bookkeeping and reporting services.
Explore the report or try your own data
Browse all 21 report pages, or request a free bookkeeping sample. Send one month of payroll, sales or expense data and we will return the detailed entries we would book within 48 hours. The free sample is journal entries from your supplied data, rather than the full monthly report illustrated here.
Share this walkthrough: HyperRoll AI sample MIS report.